Visualization
nwplot draws a network directly from the current or a named network object, with no manual
edge-list-to-coordinates plumbing required. This tutorial covers styling a static plot, exporting
publication-quality vector graphics, and building interactive and animated views of a network.
A basic plot
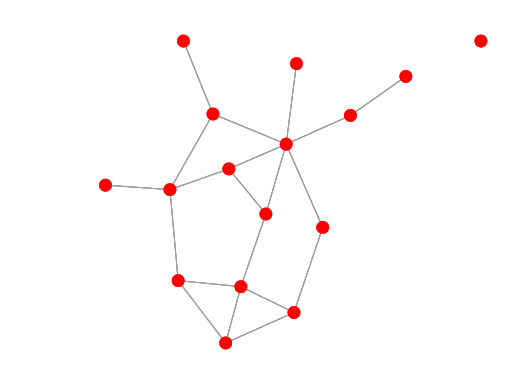
With no styling options, nwplot just shows the structure:
. nwwebuse florentine, nwclear

. nwplot flomarriage, scheme(s1network) export("plot_basic.svg") replace
Calculating node coordinates...
Plotting network...
Exporting graph to plot_basic.svg...
file plot_basic.svg saved as SVG format
Layouts
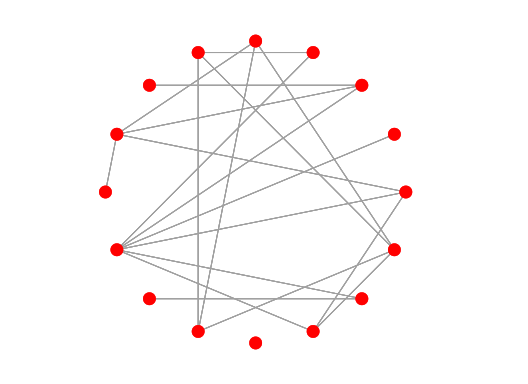
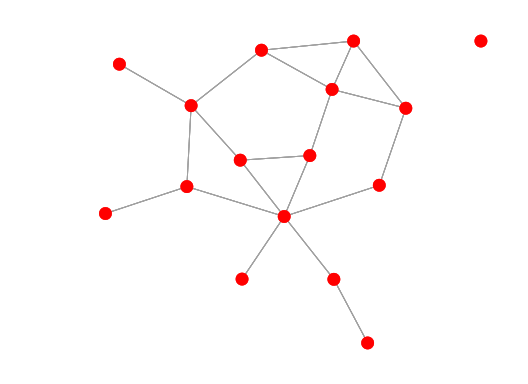
layout() controls how nodes are positioned. circle places every node on a ring; kk
(Kamada-Kawai) is a force-directed layout that pulls connected nodes closer together:
. nwplot flomarriage, layout(circle) scheme(s1network) export("plot_circle.svg") replace
. nwplot flomarriage, layout(kk) scheme(s1network) export("plot_kk.svg") replace
layout(circle) |
layout(kk) |
|---|---|
 |
 |
Styling by attribute
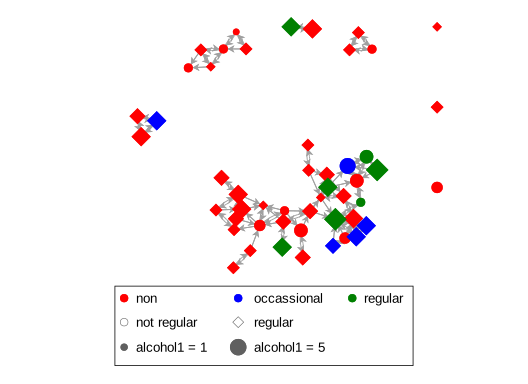
color(), symbol(), and size() each take a variable and map its values onto the plot:
. nwwebuse glasgow, nwclear

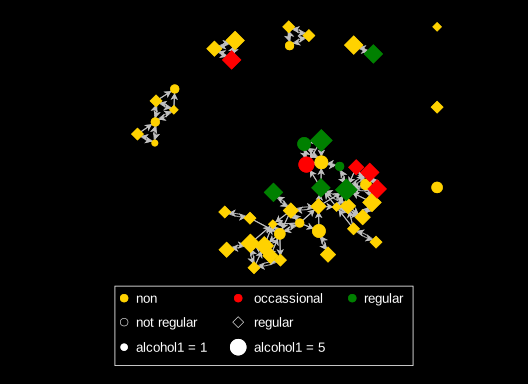
. nwplot glasgow1, color(smoke1) symbol(sport1) size(alcohol1) scheme(s1network) export("plot_styled.svg") replace
Calculating node coordinates...
Generating splines...
Plotting network...
Exporting graph to plot_styled.svg...
file plot_styled.svg saved as SVG format
Schemes
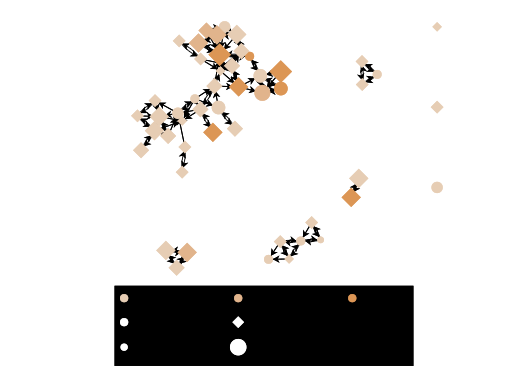
nwcommands ships three schemes purpose-built for network plots — s1network (used above),
s2network, and s3network — each giving node fill and edge line colors that are visually
distinct by default:
. nwplot glasgow1, color(smoke1) symbol(sport1) size(alcohol1) scheme(s2network) export("plot_scheme2.svg") replace
. nwplot glasgow1, color(smoke1) symbol(sport1) size(alcohol1) scheme(s3network) export("plot_scheme3.svg") replace
scheme(s2network) |
scheme(s3network) |
|---|---|
 |
 |
Highlighting a path
Combining nwpath with edgecolor() highlights a specific route through the network — here,
the shortest path between two Medici-era Florentine families. nwpath’s generate() creates a
new network per shortest path found (sp_1 here - a pair with multiple shortest paths would
also get sp_2, sp_3, …), and that new network can be passed straight to edgecolor():
. nwwebuse florentine, nwclear

. nwpath flomarriage, ego(medici) alter(peruzzi) generate(sp)

----------------------------------------
  Network: flomarriage
----------------------------------------
    Ego                  : medici
    Alter                : peruzzi
    Shortest path length : 3
----------------------------------------
  Path 1: medici <=> barbadori <=> castellani <=> peruzzi
  Path 2: medici <=> ridolfi <=> strozzi <=> peruzzi

. nwplot flomarriage, edgecolor(sp_1, legendoff) scheme(s1network) export("plot_path.svg") replace
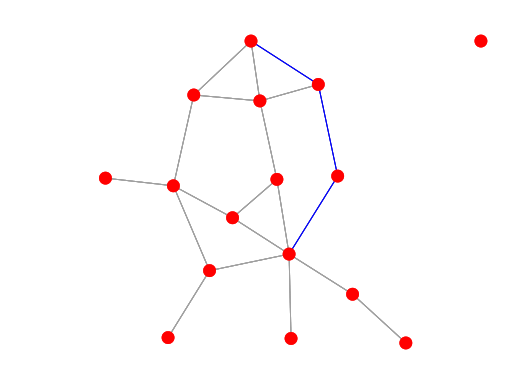
Don’t reach for edgesize() here to make the path stand out further - it scales edge width
proportionally to the variable’s own value, so a 0/1 indicator like sp_1 makes every
non-path edge exactly zero-width (invisible), leaving only the path on the plot. edgecolor()
alone is the right tool for a discrete highlight/no-highlight distinction like this.
Interactive plots
interactive opens the same plot in a browser-based, editable view: drag nodes to reposition
them, and click a color or shape swatch in the legend to recolor every node sharing that value.
It’s the same view embedded live below — try it:
. nwwebuse glasgow, nwclear

. nwplot glasgow1, color(smoke1) symbol(sport1) scheme(s1network) interactive noopen
Calculating node coordinates...
Generating splines...
Preparing interactive view...
Plotting network...
Drag any node below to reposition it. Click a legend swatch to change the color assigned to that whole group.
Two buttons in that view save your edits as CSV files — feed them back into a later nwplot call
with importcoords()/edgeimport() to reuse a hand-arranged layout. See
nwplot for the full round trip.
Movies
nwmovie turns a sequence of waves of the same network into a single, self-contained,
browser-based timeline player — drag the slider and watch nodes and ties change wave to wave:
. nwmovie glasgow1 glasgow2 glasgow3, noopen fname(friendship_movie)
Resolving network glasgow1 (1/3)...
Resolving network glasgow2 (2/3)...
Resolving network glasgow3 (3/3)...
Wrote friendship_movie.html
Drag the timeline slider below to move between the three waves of the Glasgow friendship network.